For Business & Enterprise Accounts only. To upgrade your account go to: https://www.coursebox.ai/pricingThis section explains how to track performance, engagement, and revenue across your Coursebox platform using built-in integrations and external analytics tools. As a Super Admin, you can connect Coursebox with services like Google Analytics and Stripe to gain insight into learner behaviour, traffic, and financial performance, while also leveraging third-party analytics from media and survey platforms. These tools help you make data-informed decisions, demonstrate impact, and support reporting, compliance, and continuous improvement across your training programs.
Watch the video below, or explore more tutorials in our Demonstration Video Library.
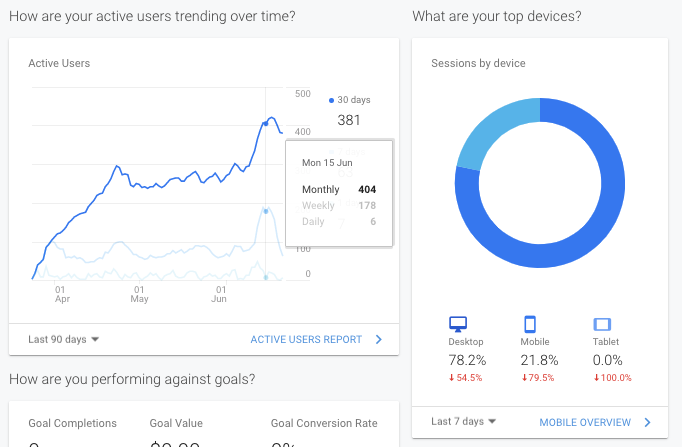
Manage Google Analytics
As a Super Admin, you will be generally about to track detailed Google Analytics on your portal.
To generate reports and analyse data:
- Log in to https://analytics.google.com
- Review data or learn more at https://support.google.com/analytics/answer/1008015?hl=en
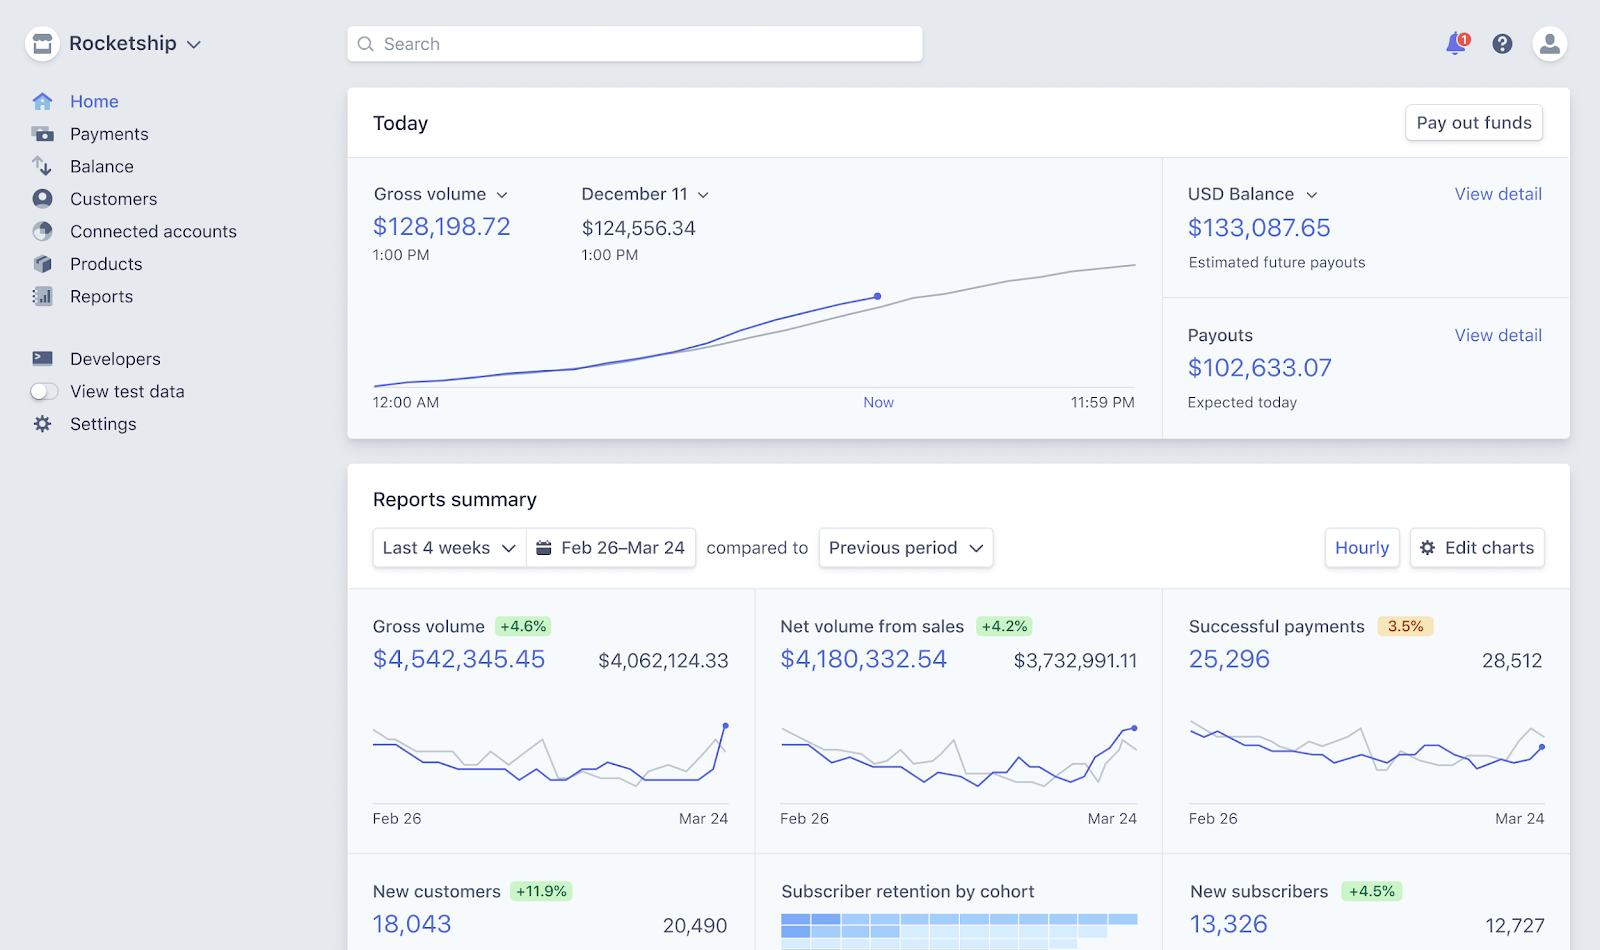
Manage Stripe Reporting
Coursebox integrates with Stripe to enable seamless payment processing for courses, groups, and bookings. As a Super Administrator, you can access and manage detailed financial reports through your connected Stripe account. This allows you to track transactions, monitor revenue, and generate reports for accounting or compliance purposes.
To get started, log into your Stripe dashboard and access the reporting tools available for your account.
If you choose to enable Stripe to accept payments:
- Log into https://dashboard.stripe.com/dashboard
- Generate reports as required or learn more at https://stripe.com/docs/reports/financial-reports
Manage Third Party Analytics
This section outlines how Super Administrators can monitor and manage analytics from integrated third-party platforms. Coursebox Branded Training Platform (Premium) supports a variety of external tools that offer additional reporting and engagement insights.
To access these analytics, refer to the individual support guides provided by each platform. Supported integrations include:
Vimeo
YouTube
SurveyMonkey
Youku
Dailymotion
Instagram
Google Slides
Canva
Support Guides:
Vimeo
Analytics Overview – Learn how to view video metrics, impressions, and advanced reports.
Vimeo Help Center+2developers.dailymotion.com+2developers.dailymotion.com+3Vimeo Help Center+3Lifewire+3YouTube
Get started with YouTube Analytics – Step‑by‑step instructions for accessing analytics in YouTube Studio, including advanced mode and exporting data.
Google Help+6Google Help+6Google Help+6SurveyMonkey
How to Analyze Results – Overview of analyzing survey responses with dynamic charts, exports, and AI-powered summarization.
pro.dailymotion.com+4SurveyMonkey+4SurveyMonkey+4Dailymotion
Analyze your performance – Guidance on using Analytics dashboards, generating custom reports (CSV), and API integrations.
Google Help+15faq.dailymotion.com+15faq.dailymotion.com+15Instagram
Instagram Analytics: Key Metrics & Tools to Use in 2025 – Insights into how to track engagement, content performance, and follower demographics.
Google Help+15Later+15SocialPilot+15Google Slides
Analytics for Google Slides – Tutorial for capturing audience engagement and slide performance analytics.
Google Help+9superslide.co+9AiPPT.com+9Canva
Viewing design analytics and insights – Instructions to view how often your shared or collaborative designs have been opened or edited.
Vimeo Help Center+3Canva+3Template Fonts+3
Was this article helpful?
That’s Great!
Thank you for your feedback
Sorry! We couldn't be helpful
Thank you for your feedback
Feedback sent
We appreciate your effort and will try to fix the article